Case Study: 'GoBoat'
website views analysis
Navigating Success with 'GoBoat', a European online seller platform
Optimizing marketing success through analyzing website views by key characteristics
(CF student case study)
Goal
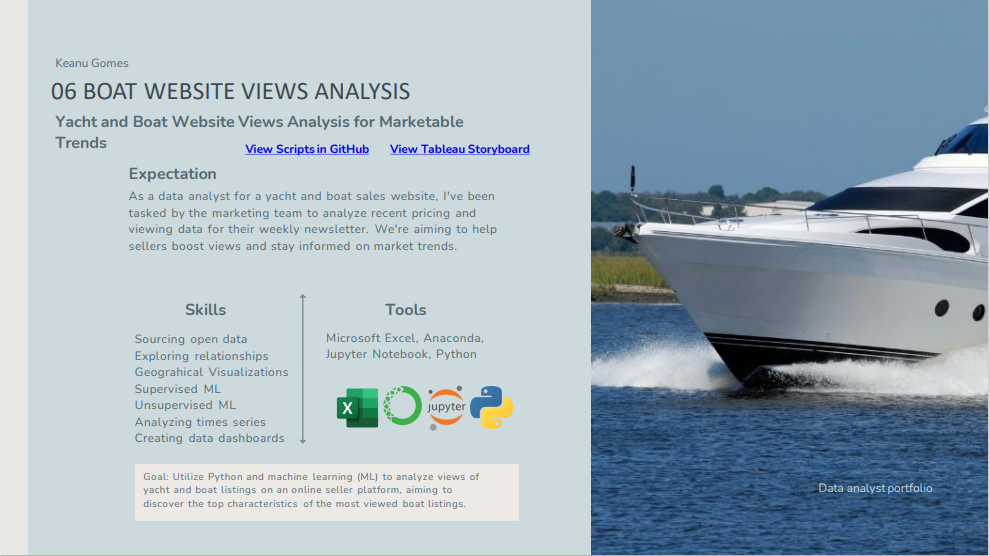
As a data analyst for a yacht and boat sales website, I've been tasked by the marketing team to analyze recent pricing and listing views data for their weekly newsletter. We're aiming to help sellers boost views and stay informed on market trends.Here are the questions they want me to answer first:
1. What are the characteristics of the most viewed listings in the past week?2. Do the priciest boats attract the most attention?
3. Are there common features among the top-viewed boats?
final thoughts
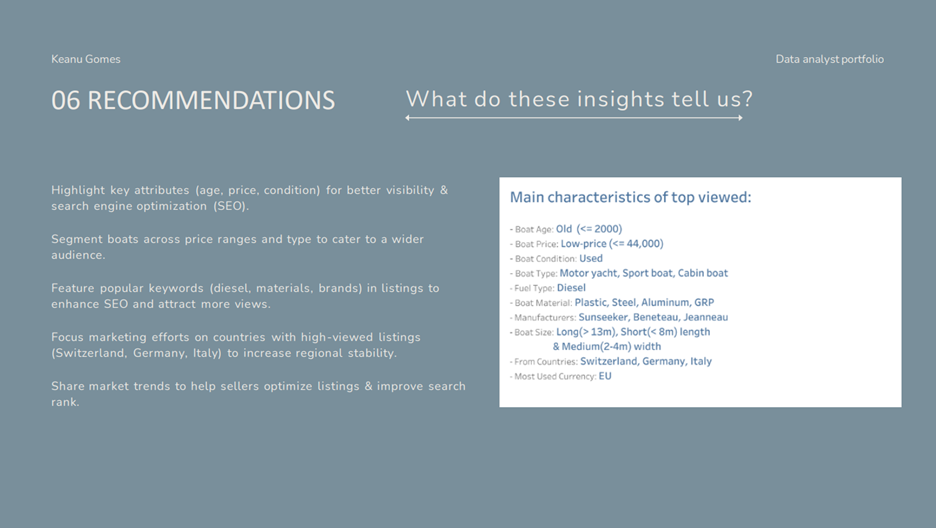
In conclusion, my case study underscores the importance of strategic approaches to enhance the visibility and search engine optimization (SEO) of GoBoat's online seller platform. Key attributes such as age, price, and condition should be highlighted to improve visibility and appeal to potential buyers. Segmenting boats across price ranges and types broadens the audience reach, while featuring popular keywords like diesel, materials, and brands in listings boosts SEO and attracts more views. By focusing marketing efforts on countries with high-viewed listings such as Switzerland, Germany, and Italy, GoBoat can increase regional stability and amplify its market presence. Additionally, sharing market trends empowers sellers to optimize listings and improve search rank, fostering a dynamic and competitive marketplace ecosystem.